Turnips & Tranquility

Where has time gone? What in the world am I doing now halfway through my life? Why am I still busting my ass HARD and yet feel I am no better off than I was when I was 25, 35, or 45-years old?

∼ ∼ ∼ § ∼ ∼ ∼

A dear friend called me the other week to ask how I was getting along. They had not heard from me in a long while—I am no longer on any popular social-media, namely Facebook, and for very good reasons. Remarkably and a bit perplexed by my unknown lostness, I found the concern odd. On the contrary, I am very much present, alive and stuck-in the typical hubbub of American life. Go go GO! Never stop! Never sleep! Make wheel-barrows of money in 28-hours a day! That’s the expected spirit here!

Yet, not being on Facebook, Instagram, Qzone, or Twitter apparently puts me off the grid somehow, or out of touch from civilization somewhere on a remote island in the Pacific Ocean ala Tom Hanks in Cast Away! Should I scream “WILSON!!!? Would 20-year olds even know that reference? Last I checked, my cell phone works perfectly. Live talks on the phone are still around, used, aren’t they? We do still speak face-to-face, correct? In proper English, not strictly acronyms in 30-character texts, yes?

Nevertheless, there was a good reason why my good friend called. The truth is I have indeed been swamped and overwhelmed not just since last Fall 2019, October to be exact, but particularly the entire month of February this year.

I am just trying to squeeze as much money out of everyone else FASTER than they can squeeze more money out of me.
Me, Professor Taboo from “How To Survive in a Cannibalistic Hyper-Capitalist Economy of America.” ®2020.

That was my final description of what my last two years have become after briefly explaining to my friend why I seemed to be lost somewhere out there. We both had a good laugh about my seemingly new, yet unintended mantra. This is no easy bloody race and it never ever ends, especially if one was not born into privilege or great wealth.

One debacle out of several I have found myself in these last 4-6 weeks was trying to speak with an actual LIVE human being both at my cell phone provider (Verizon) and with my bank regarding a second round of recent fraudulent debit/credit card charges in Atlanta, GA, Silverton, Idaho, San Francisco and Berkley, CA. Not only am I a continental traveler, but I seemingly fly in my supersonic Lear-jet from coast to coast and in between. I WISH! That’s the funny part. What is not at all funny is that it is quite difficult to begin speaking right away to an English-speaking human being. My first 5-mins with Verizon, as I satirically remember it:

“Welcome to Verizon Wireless Customer pleasuring. Are you calling about phone # (my cell #). Push 1 if this is correct. Push 2 if this is incorrect. Push 3 if somewhat correct. Push 4 if a little incorrect. Push 5 if you like ham sandwiches. Push 6 if you like green eggs with ham. Push 6½ if you enjoy Dr. Seuss. Push 7 if this menu gives you pleasure. Push 13 if it does not pleasure you. Push 8 if you want to hear all options again slower. Push 9 or 0 if you honestly think [laughing in background proceeds] you’ll get a human being to talk to.

[I make my selection]

“I’m sorry, I did not understand your input.” Then everything robotically returns to the beginning and repeats. I am in an eternal, computerized loop somewhere in Never-never Land.

Most likely this year will be dotted with several family funerals of very close aunts and uncles to Mom and sister. I am now at an age where many of my elderly aunts and uncles—perhaps even one or two of the oldest cousins—when numerous funerals could occur this year and next. One funeral has already taken place last month, a 91 or 92-year old uncle. Another is likely within the next 2-4 months, maybe? That generation and my mother’s and father’s generations typically had large families of five, seven, or in my Mom’s case eleven siblings.

In other personal events I am having to once again search for and find more feasible housing. Whether most Americans are thriving and succeeding in their pursuits of happiness, health, occupational and financial stability and mobility depends mostly on who you speak with… at length. It is a heated controversy right now and for very good reason! Why? Saturation of false and/or misleading information, facts, statistics, and contextual causes and effects. Take a close look at this graphic on affordable Texas housing from the National Low Income Housing Coalition. Notice the $40,185 wage figure:

TX Housing Needs 2019

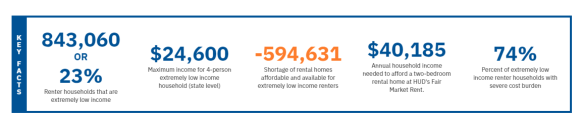
For more extensive details and data on “affordable” housing in Texas, a contradiction in terms I assure you, click here.

Most low-income (non-caucasian?) households in Texas barely make $28k to $38k per year ($14–$18/hr median) combined as couples and they’re lucky if they are afforded decent-to-good healthcare coverage from Texas employers trying everything within their power to avoid hiring full-time, 40-hr/week employees. With part-time employees (<30 hrs/week) health benefits do not have to be provided. In fact, in Texas there are no laws forcing employers to ever offer any health insurance to employees. Most do, however, only if you work 40-60+ hour work weeks; the higher the wages/salary, the more hours they demand expect from you. These are the extreme benefits and perks for businesses and business owners based in Texas, an At-Will labor-law state. This is one big reason why the Red-state of Texas has now become the 2nd fastest growing state in the nation the last 20-25 years. Cheap uneducated labor. It passed Florida last year I believe. Nevertheless, after three rate-hikes in 3-years and as a single man, I can no longer afford paying $1,360/month for my current housing and keep up with the cost-of-living.

On other news topics, I believe I have some 7 or 8 unfinished, Pulitzer Prize winning blog-post drafts each on different topics waiting their completion. Those have been on the dust-bin shelf since August of 2019. I’m lucky I almost finished this post. Several more go back further, one back to 2015 when a then divorcing friend said she’d Guest-post it for me about not divorcing when kids less than 18-years are involved. Hah, she’s now already remarried and never thinks about me anymore. Kind of funny really, how “traditional” marriage does that to people—their social-life shrinks to zilch, nada, near empty when it comes to the single opposite sex. Hmmm, imagine that.

On more news, last week and last Monday I had to spend an excessive amount of time on the phone with our county voter registration office as to why my new “permanent” registered card hadn’t arrived after 5-weeks of reapplying. Apparently my very “official temporary” card was invalid this year. I didn’t realize it had gotten so complicated. No wonder Texas has one of the poorest voter turnout rates some 20-years running! Hell, I’m an educated white man and it has become very challenging for me!

These last 6-weeks I’ve had to deal with my bank twice in less than 6-months on credit/debit card fraudulent charges. Wait a minute! When I started drafting this post last week I already mentioned this didn’t I? However, it does still continue so I too will continue it. HAH!

Keeping my personal and financial information private and protected these days is quickly becoming near impossible in this day and age of super hi-tech. Ah, but as a result, that births and stimulates another derivative industry that is profitable, doesn’t it? More and more businesses or corporations manipulate require all of it to do “better business” with you or provide a VIP service, even if you know it will only be a one-time transaction. Plus, more and more billing tasks or business dealings, contracts, etc, are for the most part entirely online. Gone are the days where you do your business in person, face-to-face. How sad. We are gradually losing our organic, communal-social contact and interactions with each other when facial expressions, hand and body movement, voice tones and inflections were important, critical in some cases, but are now unnecessary impossible on computer or cellphone screens. Am I the only one noticing these swift changes and higher risks? 🤔

I am going to skip over my health and hypertension concerns and developments over the last 10-12 years. Pretend like I never mentioned it. Besides, it would add 500-800 more whiny words to this post. Hahaha. All of you can thank me later for my kindness. (grin and wink)

Hey, I am not irritable! Well, not yet psychotic. No one has dialed 9-1-1 on me for the police. 🤣 On a positive note, I am totally digging Netflix’s Moving Art series by Louie Schwartzberg. Seen any of it? The photography and filming is unreal, vivid, and astonishingly beautiful and soothing! Or as I state in my title:  Tranquility. Check it out if you enjoy spectacular views and relaxing or cultural music on location. Here’s a teaser for season 3:

Well, I’m done. Time is over, gone. I’ve run out of it again. Reality in this great state and nation beckons for my loyal, patriotic servitude in this socioeconomic system for some, but not all. It could be much worse, right? 🤪 I could be fleeing for my life from gangs and drug cartels in Central America! But I’m a 7th-generation Texan-American! Those types are already here! I don’t have to relocate to appreciate what I was born into! Wooohooo! My turnips are shriveling up! 🥳 🇺🇸

∼ ∼ ∼ § ∼ ∼ ∼

March 9, 2020 Addition — This is a provocative article and streaming series looking into the unethical, exploiting, unscrupulous practices of real estate moguls and firms across the U.S. by The Daily Beast and the Netflix series Dirty Money, season 2 airing Wednesday, March 11th.

The second season of Netflix’s docuseries examines a number of shady financial schemes—including that of “Slumlord Millionaire” (and Trump son-in-law) Jared Kushner. […]

The overarching portrait painted by “Slumlord Millionaire” is of unrepentant real-estate scumbagggery. And somehow, it gets worse! Now ensconced in the White House, Kushner has exploited his undeserved political role to obtain lucrative financial deals for his family, which in turn has made him a figure easily exploited by foreign powers eager to gain leverage over the president. It’s a lose-lose scenario for everyone except Kushner and his cronies. The efforts of Housing Rights Initiative founder Aaron Carr and New York City Councilmember Ritchie Torres have sought to end some of Kushner’s more shady tricks, such as renting units in buildings for which he doesn’t have a certificate of occupancy. Yet the man continues to live the untouchable life thanks to his stature and sway, including over dim-bulb tenants that lament their Kushner-created nightmares and yet confess that they voted for Trump because “he takes care of business.”
by Nick Schager, Netflix Takes Aim at Jared Kushner: ‘A Tier-One Predator’ — Preying on the Poor, The Daily Beast, accessed March 9, 2020

Reception and critical reviews have been highly praised for the series so far. These practices, rent-seeking techniques in business sectors, including housing markets, have also been pointed out in highly acclaimed and awarded research and published books Dark Money: The Hidden History of the Billionaires Behind the Rise of the Radical Right by Jane Mayer and Democracy in Chains: The Deep History of the Radical Right’s Stealth Plan for America by Professor of History and Public Policy at Duke University Nancy MacLean.

There are a number of other in-depth documentaries on the subject of public policies and governing, state and federal legislators and executive administrations becoming puppets to multi-million dollar corporations and their Washington D.C. lobbyists. One example is the award-winning investigative documentary Inequality for All by Jacob Kornbluth. What has happened and is happening behind the scenes of private business-sectors mixing with and influencing state/U.S. policies and governing are NOT illusions, conspiracy theories, or Victim’s Complex. They are real and factual.

————

Live Well — Love Much — Laugh Often — Learn Always

Creative Commons License
This work by Professor Taboo is licensed under a Creative Commons Attribution-NonCommercial-NoDerivatives 4.0 International License.
Permissions beyond the scope of this license may be available at www.professortaboo.com/contact-me/.

A Collective Imperative

(paragraph break)

If a free society cannot help the many that are poor,
it cannot save the few who are
rich.
— John F. Kennedy

(paragraph break)

[This is the fourth and final segment of a series continuing from part 3 – Unveiling Incentive-Opportunity Fallacies] (paragraph separation)

(paragraph break)

* * * * * * * * * *

What is excessiveness?  The dictionary defines it this way:  exceeding a normal, usual, reasonable, or proper limit.  Historians have sometimes defined it as out Herod Herod.  Lord Salisbury in Shakespeare’s King John perhaps described it better as painting the lily:

Therefore, to be possess’d with double pomp,
To guard a title that was rich before,
To gild refined gold, to paint the lily,
To throw a perfume on the violet,
To smooth the ice, or add another hue
Unto the rainbow, or with taper-light
To seek the beauteous eye of heaven to garnish,
Is wasteful, and ridiculous excess.

Every single human being requires a handful of necessities:  water, food, climate-control, and shelter.  To what extent or elaboration those four basic needs are fulfilled, can be averaged at any location, and thus a global standard can be determined.  One and perhaps a minimum of two of these basic life-needs are in finite supply and crisis on our planet.

Fair warning for those who are sensitive to or bothered by grim facts of nature, our planet, and other human groups, self-discretion should be considered.  What follows, in my opinion, needs to be at least made aware and considered by everyone on Earth.

(paragraph break)

* * * * * * * * * *

What do you think would happen if when you turned open your faucet and nothing came out?  How long could you survive without water?  Now, what do you think would happen if your entire city was without water or operating sewage?  What would happen if a nation lost its water and sewage?  There is no water to feed crops or gardens; no clean water to drink.  Are you getting the picture?  If not, let’s hear the alarming projections some scientists, scholars, and professional experts are reporting.  Sorry this alarming documentary is an hour-and-a-half long, but it needs to be shared:

If you still feel this is not a problem for you and your children and grandchildren, you should have your ears examined.  If you feel resource conservation is a form of socialism or communism, then you are in delusional denial.

Excessive opulence or resource hoarding is no different a global footprint than spending or consuming recklessly; they both accomplish the same singularity:  proportionate risk.  The more excessive, the more risk; the more risk, the more excessiveness to avoid it.  As a species, if not as Americans, we need to…no, we must greatly refine our life-ambitions and the education of those ambitions and their purpose.

But let’s pause a moment and analyze where most Americans have headed since 1870 and are currently heading.

1870 – 1900:  The Gilded Age
Mark Twain

Mark Twain

Much pride and boasting has been made of America’s age of industrialization, that it was the catalyst that put the nation in the same discussion of the world’s greatest empires.  Yet of our nation’s 12-million families then, 11-million earned less than $1,200 per year; of this group the average annual income was $380, well below the poverty line.  In today’s CPI dollars (the purchasing power of goods and services produced in the 1890 economy) that is $9,890 per year per household.  In his book The Gilded Age: A Tale of Today, Mark Twain wrote of the day’s barons and tycoons, What is the chief end of man?—to get rich.  In what way?—dishonestly if we can; honestly if we must.

Though pre-1920 U.S. economic reports are less comprehensive as post-1920, Benjamin Schwarz of the World Policy Institute and Executive Editor of World Policy Journal writes in his 1995 New York Times article By 1890, the richest 12-percent of households owned about 86-percent of the country’s wealth.

1890 – 1920:  Progressive Era
The Roaring Twenties

The Roaring Twenties

In 1910 the average annual household income was $574 per year.  In today’s CPI dollars that is $14,300 per year per household.  During this era America’s top 1-percent owned about 40-50 percent of the nation’s wealth and the top 10-percent fluctuated around 70-percent until President Theodore Roosevelt began his anti-trust legislation and wealth redistribution via progressive taxation.

1920 – 1929:  The Roaring Twenties

The average annual household income was $1,407 per year in 1920.  In today’s CPI dollars that is $16,100 per year per household.  In 1922 America’s top 1-percent owned 37% of the nation’s wealth; a slight change in years following Teddy Roosevelt’s administration.  America’s middle-class indeed experienced a relative age of prosperity during the Roaring Twenties due to the automobile industry which fed industries such as oil, road-construction, tourism, manufacturing, and electric-power.

1929 – 1941:  The Great Depression

the-great-depressionThe average annual household income in 1930 was $1,388.  By 1940 it had dropped to $1,315.  In today’s CPI dollars that is $19,100 and $21,500 per year per household respectively.  America’s top 1-percent in 1933 owned 33% of the nation’s wealth and 36.4% in 1939 demonstrated the upper-upper class comfortably rode out the stock market crash of ‘29.  Unemployment for the nation’s middle class was at 25% and especially higher in heavy industries such as lumbering and agricultural exports in cotton, wheat, and tobacco.  Fortunately, from a purely economic standpoint, another world war was on the horizon ready to put Americans, particularly women, back to work on a road to bigger prosperity than the Roaring Twenties.

1945 – 1973:  Postwar Prosperity – The Golden Era

The average annual household income was $3,180 in 1950 ($30,300 in 2012 CPI) and $4,816 in 1960 ($37,300 in 2012 CPI), a significant increase in just 10-years.  Middle-class Americans also enjoyed a bigger piece of the nation’s wealth:  70.2% in 1945 and 73% in 1949 while America’s top 1-percent saw their portion drop again to 29.8% and 27% respectively.  Yet, it is this Golden Era that firmly placed the United States as a world power and dominant economy.  As more and more Americans gained more wealth and more income, the nation experienced its most prolific prosperity to-date.  How it happened will be examined shortly.

The American Dream

The American Dream

When Dwight Eisenhower took office (1953-1961) the nation was going through another recession post-Korean War causing a decline in the nation’s GDP.  This resulted in middle-America having less of the nation’s wealth over a 16-year period down to 65%, while America’s top 1-percent relished in increases back up to 34.4% of the nation’s total wealth in 1965.

By 1970 the average annual household income was $7,494 or about $44,300 in today’s CPI dollars; another notable increase in 10-years.  As the Golden Era drew to a close and the Cold War and Vietnam festered, President Lyndon Johnson’s Great Society programs increased lower and middle-America’s wealth to 71% while America’s top 1-percent saw theirs fall to 29% of the nation’s wealth.  However, hard times were just around the corner for most Americans.

1970 – 1976:  Age of Stagflation
Image Time Warner

Image Time Warner

In 1973 the average annual household income was $9,037 or approximately $46,700 per household in today’s CPI dollars.  The nineteen-seventies became known economically as the Age of Stagflation.  The 25-year U.S. economic growth post-WW2 had stagnated to a crawl, and prices in goods and services rose annually in the double-digits from 10% in 1973 to 18% in 1979.  Due to poor performances on Wall Street, America’s top 1-percent saw their share of the nation’s wealth drop to the lowest in history:  19.9%.  Yet, middle-America enjoyed the highest ever share of the country’s wealth at 80%.

The eras of suburbanization in the 50’s and 60’s, however, had significant consequences in the 70’s.  The migration of tens of millions of middle-Americans (most of them White), moving to newly developing suburban towns meant getting to work in cities went from public transit to private vehicles.  This in turn caused America to become heavily dependent on foreign oil.  The long-term varied ripple effect of suburbanization cannot be overemphasized, one of which is our bigger footprint on environmental and global issues.

Wolff Table 1 Wealth

1976 – 1992:  Gilded Age Returns and Reaganomics
Reagan addresses Congress 1981 (Wikipedia)

Reagan addresses Congress 1981 (Wikipedia)

From 1976 to 1988 the average annual household income was $11,080 or about $44,700 in 2012 CPI dollars – yes, a $2,000 drop from the previous 3-years – to $25,167 or about $48,800 in 2012 CPI dollars; just above break-even from 1976.  To combat the stagflation of the 70’s, government deregulation along with personal and business tax cuts gained popularity.  As it turned out most of the tax breaks, along with deregulating helped America’s upper-classes.

Additionally, defeats of labor unions – unions made possible by Teddy Roosevelt reforms with long histories of keeping big-businesses from corruption and abuse of workers – also fattened the pockets of America’s top 1-percent by going from 19.9% ownership of the nation’s wealth to having 35.7% by 1989.  By 1992 the AAHI (average annual household income) was $28,870 or about $47,200 in 2012 CPI dollars; another drop from 1988.  While middle-America struggled, the top 1-percent in America owned a rising 37.2% of the nation’s total wealth.

Beginning in 1983 economist Edward Wolff has tracked America’s net wealth and financial (non-home) wealth distributions.  As Table 1 above and Figure 1 below show, it is an increasingly bleak outlook for the majority of Americans.

Figure 1 Net & Financial Dist

Click image for larger view

1990 – Present:  Globalization and World Superpower

The 1990’s will be compared to the prosperity of the 1920’s and the 1960’s.  But as a whole is that what the data reveals?  The AAHI was $32,558 in 1995 or about $49,000 in 2012 CPI dollars and America’s top 1-percent enjoyed another increase in the owned wealth of the nation at 38.5%.  For six brief years (1994-2000) the economy saw rises in the national debt, the stock market, and the GDP while inflation plateaued and unemployment dropped below 5% because of the Dot-com Boom.  Economist and civilians alike agree that the growth explosion was mostly a result of workplace computerization.  But the good times would come to an end in 2001.

Map of the world wide web

Map of the world wide web

A constant influx of immigrants seeking the American Dream, an American economy becoming one of the major players in a growing global economy, a false sense of security in the housing market, and numerous corporate scandals in the energy and finance sectors due to previous government deregulating, all contributed to the tipping-point by 2007.  The AAHI in 2000 was at $40,418 or $53,900 in 2012 CPI dollars and the top 1-percent in America saw their portion in the nation’s wealth drop to 33.4% due to a sharp declining stock market worsened by the attacks of 9/11.  There is another set of globalization dynamics that added to the plight of middle-America.

With the exodus of American jobs like cheaper electronics, fashion, shoes, and toys moving to developing nations, middle-Americans watched as their job and salary-leveraging also weakened with fewer lateral or upper employment positions.  Then jobs in TV, auto, steel, and home-furnishing manufacturing followed.  With those positions gone abroad, the American job-market went from high-paying management positions to simple service-industry low-paying positions which certainly need no college degree.  This move marked the boom of trade-school certifications for a growing electronic blue-collar job-market.

manufacturing_mexico

Why Mexico is becoming a global manufacturing power – Bloomberg Businessweek article

The domino-effect of American digitization, the snowballing Internet, and high-speed networks spreading to all corners of the globe have combined to gorge the growing socio-economic gap wider and deeper.  In 2007 the AAHI was $48,332 ($53,500 in 2012 CPI dollars) eaten-up by inflation and the cost-of-living.  Meanwhile, the top 1-percent owned a steady 34.6% of the nation’s wealth.  The lap of luxury doesn’t stop there.  With the creation of a connected more global economy today, along with new multiple global opportunities and substantially lower-wages to foreign workers, it should come as no surprise what sector of the American population currently enjoys the fruits-of-foreign-labor.

The World’s 200 Richest People(s):

The most industrialized developed countries in the world by population-size are in Europe according to the 2013 United Nations Human Development Report.  Of the top 10 nations with the highest Human Development Index (HDI), six of them are in Europe (see Report).  One might infer from that list then that many of the world’s wealthiest people reside in those countries or at least in Europe.  You would be wrong.

Of the 200 richest people in the world as of 2012, 61 of them (or 31%) are citizens of the United States.  What is perhaps unexpected is where the second richest group of people call home.  Of the next 139, 20 of them (or 10%) are Russian, ironically a former part of the old communist U.S.S.R.  The next 26 richest people come from Germany (13) and Brazil (13) at 7% and 6.5% respectively.  To see the world’s wealth and what portion of it is owned by the wealthiest 200, see the pie-chart below.  For the most current world ranking of the world’s wealthiest as ranked by Bloomberg click here.

Wealthiest 200 pie-chart

As the largest population of one of the most modern industrialized nations – currently 314 million and growing – the United States has the largest percentage of the population with the smallest percentage of the nation’s wealth.  Since 1983, as seen in Wolff’s two Tables above, it has decreased every single year.  To put this disparity succinctly, in terms of financial eggs-in-a-basket the top 1-percent own 35% of all privately held stock, 62.4% of all business equity, and 64.4% of financial securities in America.  Is it any wonder why middle-American taxpayers were held for ransom in 2008 to bailout our own mega-banks and financial firms, mega-auto companies, and integral government-sponsored entities?  The top 1 and 10-percent held the nation by the balls.  Sit down, it get’s more alarming.

largeextremeinequalitychartThe top 10-percent own 81% to 94% of all American bonds, trust funds, stocks, and business equity, and nearly 80% of all commercial real estate.  The real value of financial wealth is determined by control of income-producing assets; assets that can absorb recessions or devastating irreparable depressions.  Therefore, it is reasonable to conclude that 10% of Americans own the United States.  Talk about utter investment stupidity in placing the nation’s “eggs” in one or two baskets!  There is no way to sugar-coat it.  Perhaps Abraham Lincoln’s Gettysburg Address should be rewritten to reflect today’s socio-economic times:  Government of the 10-percent, by the 10-percent, for the 10-percent.

Land of the Few, Home of the Lavish

Listed at $190-million, Copper Beech Farm in Greenwich, Connecticut is the most expensive home in America.  Built in 1896 and previously owned by the Greenway family of U.S. Steel with Andrew Carnegie as well as timber tycoon John Rudey, it has over 13,000 square feet on 50 waterfront acres with spectacular views of Long Island Sound.  As a French Renaissance style home with 12 bedrooms, wine cellar, a 75-foot outdoor pool, a grass tennis court, a large formal arboretum, two greenhouses, and private apple orchard, accessible by a 1,800-foot private driveway.  Oh, and the property includes two offshore islands.

Copper Beech - Greenwich, CT

Copper Beech – Greenwich, CT

Copper Beech Farm is simply one home of over 100 homes priced above $10-million.  From 2005 through 2012 Greenwich, CT has been ranked as the best wealthiest place to live in the U.S., the “Biggest Earner” per household in the U.S., and #1 wealthiest residents per capita in the nation.  Many of the residents are Wall Street hedge fund managers, writes Nina Munk of Vanity Faire Magazine, and “of the $1.2 trillion currently invested worldwide, approximately one-tenth, or $120-billion, is now managed out of Greenwich alone, according to Hedge Fund Research, Inc.”  Munk also reports that four of the richest 400 Americans live in Greenwich and three of those are hedge fund managers.  One Greenwich real-estate broker reported these four residents will drop five to eight-million dollars without a second thought.  Some even a lot more.

Almost As Big as the Taj Mahal –
To judge by the number of swollen, over ambitious mansions rising from lots in Greenwich these days, you’d almost think we were back in the 1910’s and 20’s – except that this time round the lots are small, and the houses are almost on top of one another.  “Years ago, wealthy houses were hidden in the rear of properties after long driveways…and no one ever built to the maximum allowable square footage,” remarked Diane Fox, long time director of Greenwich’s Planning and Zoning Department, in an e-mail to me.  “Today all big houses want to be seen from the road.””

Munk’s article of Greenwich’s rich and lavish also mentions that one interior designer installed broadloom carpet at $74,000 for one bedroom, and drapes and curtains at $20,000 to $25,000 for one bedroom.  You read it right, one bedroom.

Why is this level of wealth and excessive opulence worth mentioning?

Because today American legislation, political campaigns, and economic policies resemble little of what they did six decades ago.  In 2010 the U.S. Supreme Court allowed American corporations, including those owned by the top 1 and 10-percent of the nation, the opportunity of donating vast financial resources for political candidates and their election campaigns; “resources” with millions of dollars beyond what any individual voters could organize.  Remember, 80 to 90 percent of Americans hold or own just 4.7% of the nation’s financial wealth.  The political phrase in the 1940’s and 50’s “one person, one vote” means today “one dollar, one vote.”  That 2010 decision sets the stage for a class of super-wealthy political campaigners to push (as if a majority of individual voters) their one-dimensional political-economic interests:  enhancing their profits and revenues.

A Communal America is Imperative

This four-part series has not been about political, economic, or social envy.  It seems the bottom 99% or 90% are for the most part not jealous of America’s gazillionaires or their social contributions and hard-earned incomes.  What this four-part series has been about though is political fairness, representation, and efficiency.  As discussed in part two Productive Inequality, rent-seeking moves wages and wealth from the bottom and middle classes to the top 10 and 1-percent while distorting the “free market” in favor of some and to the detriment of most.  More “efficient” policies of the market matter for a more equitable distribution of national wealth.  Improper policies (e.g. of the last 32-years) lead to a less efficient economy and a growing divide between socio-economic classes.

Strength in lots of Einsteins!

Strength in lots of Einsteins!

It is a fairly simple overall concept.  When our society is sufficiently (even abundantly) funded in infrastructure, education, research, and technology, these vital areas of a thriving economy offer hope and security to ordinary citizens.  The majority of Americans, the bottom 90%, will actually SEE and experience for themselves what the U.S. Constitution, the Statue of Liberty, and all other symbols of democracy, equality and fairness are really made of… not just “promised” or rhetorically talked about on TV.  Those principles would be available to a vast number in society in an efficient dynamic economy.  Even the top 1-percent would benefit when the capabilities of so many quality workers and citizens are not wasted but fully utilized.  It’s a concept of not just strength in numbers, but strength in well-educated, ingenious, motivated Einstein numbers!  There is a huge difference between the two.  The difference is not just inclusive, but very alien to exclusive.

In his superb book The Price of Inequality:  How Today’s Divided Society Endangers Our Future, Nobel Prize winner in economics Joseph Stiglitz gives a superbly educated agenda on exactly how American government and her 314-million citizens can avoid falling into the same death-trap history’s great empires and their leaders fell into.  If you would like to read an outline of his proposed extensive agenda, click here.

My own meek semi-educated ideas of how not to follow, for instance, the Roman Empire’s demise or the former Soviet Union’s, or the more recent countries of Egypt, Tunisia, and Syria… are this:

What is the reading on your/our Collective-Goodness-Gauge?  What is the health of your/our common welfare, our passion for civic responsibility and the well-being of the persons near us?

These are NOT just social questions!  More importantly they are political and economic questions too.  As the French political philosopher Alexis de Tocqueville noticed about the nature of American society in 1835, freedom (or individualism) can be a tricky balancing act within democracy.  Some “individualized” Americans independent of a majority often have the pragmatic realization that looking after the welfare of others is not only good for the soul, but is equally good for business and wealth.  Stiglitz elaborates on this truth wonderfully:

“The top 1 percent have the best houses, the best educations, the best doctors, and the best lifestyles, but there is one thing that money doesn’t seem to have bought:  an understanding that their fate is bound up with how the other 99 percent live.  Throughout history, this has been something that the top 1 percent eventually do learn.  Often, however, they learn it too late.”

Americans together

…no matter class or status

The Roman Empire, Egypt, Tunisia, and Syria are just four examples to what Stiglitz refers.  The former Soviet Union is an example of no individualism when no single “part” is allowed to reach its full brilliance and potential for the benefit of the whole; the other extreme.  Both ends of the economic-socio-political spectrum REQUIRE resource investments and management from every single citizen.  The stable “middle” if you will, has a steady balanced, efficient, fair, and equal flow of civic investment.  Any one mechanism cannot efficiently coexist without the other efficient mechanisms.  So…

If the United States wishes to return as one of the best symbols of freedom, liberty, democracy, and equality for all, then reaching that efficient balanced middle is an imperative collaborative, collective return to a well-managed, well-governed, wealth-balanced cause.

* * * * * * * * * *

Further information —

Inside Job

(paragraph break)

(paragraph break)

Creative Commons License This work by Professor Taboo is licensed under a Creative Commons Attribution-NoDerivs 3.0 Unported License. Permissions beyond the scope of this license may be available at https://professortaboo.wordpress.com.

Abundance Without

As part of the Alternative Lifestyles blog-posts migration over to the new blog The Professor’s Lifestyles Memoirs, this post has been moved there. To read this post please click the link to the blog.

Your patience is appreciated. Thank you!

The Land of Opportunity?

(paragraph separation)

As some of you are aware, I teach 4th through 12th grade Special-Ed science, social studies, and secondary career development at a charter school.  Close to two-thirds of our students are either wards-of-the-state and/or special-needs.  Due in part to the nation-wide recession and severe federal-state education cuts and the increasing gap of social-economic inequality in America (families in poverty vs. families with great wealth), my workload and hours are increasing between 25-30% for the 2012-2013 school year.  However, my meek salary and annual increase has been frozen – while our cost-of-living continues to run free like a gorilla in a banana farm.  Even more astonishing, the social expenditures to address and manage our nation’s growing impoverished families – the exact families my students come from – are dropping through the basement in alarming amounts.

I am not blowing a horn that many haven’t already heard:  America is in a very serious economic and social crisis!  But what I would like to convey is a re-evaluation of a socio-economic system that like the Roman Empire, is heading toward collapse.

Here is a crash-course in basic social sciences.

From Tribe to Modern Civilization…and Back?

All people on this planet have the same basic needs for food, water, clothing, and shelter.  People everywhere live in families, or primary groups, and they get these needs in one of two ways:  in a way that is individually and socially beneficial, or in a way that is damaging socially and eventually to themselves, i.e. illegally according to the group’s/society’s laws-of-behavior.  The methods of obtaining these basic life-needs are directly proportional to a society’s advancement or decline in relation to available resources; or in an advanced civilization, the opportunities available.  I would like to elaborate on this basic social equation.

Advancement in a civilization can be categorized in six stages essentially developing for the greater good.  Decline in a civilization is the reverse of these stages coupled with and caused by increased crime, civil revolt, and/or war(s), and deteriorate the greater good.  In my diagram Development of Civilization right, the United States is by global comparisons clearly in the last blue stage.  However, most indicators show that we are digressing, not only by global rankings but by our own domestic indicators as well.

The Human Development Index (HDI) is an index created by the United Nations Development Program to measure development of all member nations according to a composite indicator of life-expectancy (healthcare), educational attainment for youth and adults (primary, secondary, and tertiary programs & literacy rates), and finally individual income-wealth (Per capita gross domestic product).  According to the index covering 1975 to 2005, a thirty-year period, you might be surprised that the United States does not rank in the top 10.  Over the scope of annual indices the U.S. ranks higher.  However, a 30-year scope shows a trend.  Here are the rankings:

  1. Iceland
  2. Norway
  3. Australia
  4. Canada
  5. Ireland
  6. Sweden
  7. Switzerland
  8. Japan
  9. Netherlands
  10. France
  11. Finland
  12. United States

Life-expectancy is directly related to a society’s or nation’s healthcare system.  In the 1975 Human Development Index the United States ranked sixth barely above Norway; a real fall in less than one family generation for one of the most advanced civilizations.  However, this 30-year index doesn’t paint the whole picture.  The World Health Organization (WHO) published a ranking in 2000 of the world’s health systems.  Out of 190 nations the U.S. ranked 37th.  The 2000 report was WHO’s last publishing due to vast complexities in compilation.  The Common Wealth Fund did a study of 19 industrialized nations on deaths considered amenable to healthcare before the age of 75.  In their 2002-2003 study the U.S. ranked 14th.  Yet, the U.S. ranks 1st or 2nd worldwide in total expenditures toward healthcare as a percentage of its GDP according to WHO.  To put it another way, in Italy, Hong Kong, France, or Japan, citizens pay much less for noticeably better overall healthcare.

The attainment of education is also directly related to a nation’s social and economic development or decline.  Education and literacy directly affect a civilization’s progress.  If literacy and education are stable and improving, so goes the civilization.  If education and literacy are unstable and declining, so goes the de-civilization of its people.  According to the Organization for Economic Cooperation and Development (OECD) the U.S. ranked 16th worldwide for literacy (reading, math, & science above 15 yrs old) in 2000, ranked 27th in 2006, and 23rd by 2011 according to UNESCO.  A muddling in the mid to low 20’s will not improve over future generations unless attainment of quality education by our general population improves.  This in turn requires tax revenues as well as a proportionate per capita GDP.  But this is not happening.  Though America is one of the wealthiest nations in the world, the overall American standard of living has been in serious decline since at least 1981.

A dysfunctional healthcare system and underfunded public education system will have tragic implications for American society.  Joseph E. Stiglitz is the 2001 Nobel Prize winner in economics.  He writes in The Price of Inequality:  How Today’s Divided Society Endangers Our Future:

The consequences of pervasive and persistent poverty and long-term underinvestment in public education and other social expenditure [healthcare] are also manifest in other indicators that our society is not functioning as it should: a high level of crime, and a large fraction of the population in prison.  While violent-crime statistics are better than they were at their nadir (in 1991), they remain high, far worse than in other advanced industrial countries, and they impose large economic and social costs on our society.  Residents of many poor (and not so poor) neighborhoods still feel the risk of physical assault.  It’s expensive to keep 2.3 million people [illiterate or semi-illiterate] in prison.  The U.S. incarceration rate of 730 per 100,000 people (or almost 1 in 100 adults), is the world’s highest and some nine to ten times that of many European countries.  Some U.S. states spend as much on their prisons as they do on their universities.

As I mentioned earlier, a civilization on the decline has increased crime intertwined with widening social and economic wealth-to-poverty levels.  When the opportunities for socio-economic advancement are hard, few and far between for a country’s impoverished, or semi-bankrupt per capita GDP families making only $41,890 per year in 2005, obtaining basic or moderate life-needs turns immoral or criminal.  At least two sets of statistics indicate this trend.

Generation Extreme – Death Rates of Young People

This bleak outlook doesn’t improve.  In 2011 the Murdoch Children’s Research Institute and University of Melbourne published a table ranking 28 industrialized – or modernized – civilizations according to their mortality rate of 10 to 24 year olds per 100,000 population by traffic accidents, violence, suicide, and “other” causes.  Sadly, it ranks the United States first in all four categories, with the most glaring difference being deaths by violence, out doing the other 27 countries substantially.

One way or another these numbers can be attributed to any combination of three variables:  lack of happiness, lack of education, and lack of social-balance.  And these three factors are derived from available or unavailable resources and opportunities.

A Growing Popularity toward Immorality and Crime

Get a stout cocktail, this statistic doesn’t paint a pretty picture either.  In 2007 the United Nations Development Program (UNDP) released statistical data regarding nation’s prison populations and incarceration rates.  Once again the U.S. ranks first, or highest in number of prisoners per 100,000 population.  Our total prison population is nearly three times higher as the second highest nation Russia.

One indicator of the immorality rate is hate crime statistics.  In 1990 Congress enacted the FBI Hate Crimes Statistics Act but not all states reported during the following five years.  In 1996 all fifty states reported their data.  Here are those results for the following 14-year period shown in the table.

As the data indicates, religious, ethnic/national origin, and sexual orientation are and have been on a steady climb.  A statistic I do not need to illustrate is America’s appalling divorce rate (over 50% in 2010).  For the sake of time, I will also not include incidents of domestic-family violence not related to racial, religious, ethnic/national origin, sexual orientation, or physical-mental disability.  These cases are typically attributed in various combinations to psychological, psychiatric, and drug-abuse or addiction.  Naturally the treatment and management of these problems goes back to available healthcare, and on a broader scale education, employment/unemployment, and overall happiness.

I stated earlier that the United States is on a path to socio-economic collapse, remarkably like the great Roman Empire.  The familiar cliché history repeats itself, could not be truer here.  Yet, many Americans believe we are the strongest wealthiest nation on earth of which all nations should model themselves.  True, but only on the surface and ONLY in the top 1 percent of the population or the top 10% at best.  The lower 90-99% has seen their standard of living erode frankly.  Nobel Prize winner Joseph Stiglitz describes our historic predicament strikingly Romanesque:

If struggling poor families get our sympathy today, those at the top increasingly draw our ire.  At one time, when there was a broad social consensus that those at the top earned what they got, they received our admiration.  In the recent crisis, however, bank executives received outsize bonuses for outsize losses, and firms fired workers, claiming they couldn’t afford them, only to use the savings to increase executive bonuses still more.  The result was that admiration at their cleverness turned to anger at their insensitivities…

…We described earlier the huge gap between CEO pay and that of the typical worker – more than 200 times greater – a number markedly higher than in other countries (in Japan, for instance, the corresponding ratio is 16 to 1) and even markedly higher than it was in the United States a quarter century ago.  The old U.S. ratio of 30 to 1 now seems quaint by comparison…

…What’s worse, we have provided a bad [model], as executives in other countries around the world emulate their American counterparts.  The UK’s High Pay Commission reported that the executive pay at its large companies is heading toward Victorian levels of inequality, vis-à-vis the rest of society (though currently the disparity is only as egregious as it was in the 1920’s).  As the report puts it, “…publicly listed companies sets a precedent, and when it is patently not linked to [overall] performance, or rewards [overall] failure, it sends out the wrong message and is a clear symptom of market failure.”

If you are familiar with ancient Roman civilization, or even Victorian civilization in Europe, then you are also familiar with the stark inequality of their respective populations.  Both Rome and the great British Empire of the 18th century CE crumbled under this bloated weight of inequality.  Rome vanished and Britain to a mere semblance of its former glory.  Obviously at the risk of oversimplification, this socio-economic inequality is the consequence of the denial of the altruistic and philanthropic system of the Greatest Good for the Greatest Number lifestyle.  I will return to this concept later, but first I want to explain another accurate form of socio-economic performance.

The Gini Coefficient (illustrated left) measures the degree of inequality of the distribution of family income within a nation.  Basically, a gini coefficient of zero indicates perfect equality, and a gini coefficient of one represents a maximum inequality of incomes.  Nations with coefficients of 0.3 or below are considered mostly equal.  Nations with coefficients of 0.5 or above are considered mostly unequal.  If you have finished your stout cocktail, pour another because this U.S. comparison to the rest of the world is going to break your heart.

According to the 2011 CIA World Factbook – Gini Index, the United States ranks practically the same as Cameroon (Africa) and Uruguay (South America).  Stiglitz puts it in these terms:  “According to UN data, we are slightly more unequal than Iran and Turkey, and much less equal than any country in the European Union.”  Our actual CIA World Factbook ranking has us at 95th, behind the likes of not only Cameroon but Uganda, Nicaragua, Vietnam, Mongolia, and Pakistan to name a few.

The Indicators Re-examined

Performances of family income inequality don’t tell the entire story.  The Land of Opportunity’s real story may in fact be much worse than these numbers are indicating.  For example, in other modern European civilizations their people do not worry about how to pay medical expenses, or how to afford taking care of their elderly parents, or how their children will receive a well-funded education.  Attaining all these social benefits are viewed as a basic human right!  In other advanced nations, the citizens put a heavy emphasis on hard work at a job, but they do not worry so much if they lose their job because their unemployment programs are good.  In these advanced countries, homeowners do not concern themselves with foreclosure anywhere near as much as Americans.  Social and economic insecurity for lower-class and middle-class Americans has become the rule-of-thumb.  And if these international comparisons bear some level of truth, the United States is worse off than it prefers to portray itself.

If the picture is not quite in focus, then Stiglitz concludes these performance indicators this way:

  1. Recent U.S. income growth primarily occurs at the top 1 percent of the income distribution.
  2. As a result there is growing inequality.
  3. And those at the bottom and in the middle are actually worse-off today than they were at the beginning of the century.
  4. Inequalities in wealth are even greater than inequalities in income.
  5. Inequalities are apparent not just in income but in a variety of other variables that reflect standards of living, such as insecurity [fear and sadness] and health.
  6. Life is particularly harsh at the bottom – and the recession made it much worse.
  7. There has been a hollowing out of the middle class.
  8. There is little income mobility – the notion of America as a land of opportunity is a myth.
  9. And America has more inequality than any other advanced industrialized country, it does less to correct these inequalities, and inequality is growing more than in many other countries.

As the American Conservative Right describes this socio-economic outlook, even Mitt Romney, these facts are inconvenient to them and should be whispered in private.  There is no need to point out what sectors of the American population the phrase “American Conservative Right” refers.  However, the philosophy they cherish, project, and protect is essentially no different from Ancient Rome’s and Victorian Britain’s elite.  The proverbial phrases “You need money to make money” and “the rich are getting richer and the poor poorer” are simply true today.

Greatest Good for the Greatest Number

One could argue that the concept of the greatest good for the greatest number is socialism and its initiative found in communism.  This type of argument is frequently revealed in American Conservative Right rhetoric.  Not surprisingly, you also discover that the Conservative Right has a majority of religious-political advocates, many from various forms of Christianity (and a growing population of Islam).  I find this social-political position utterly fascinating and in alarming conflict with the founding principles of the very same theology (and scriptural basis) they proclaim membership.  For a more in depth look at this background, read my April 2011 article Constantine:  Christianity’s True Catalyst/Christ.  It and its references bring to light the utter success that the Judeo-Jesus movement of the 1st century CE was in reality a welfare-system phenomena for Rome’s grossly outsized and mistreated poor; ironically, not unlike the heading of America’s social-economic system.

Simply and factually put, the philosophy-turning-lifestyle of the Greatest Good for the Greatest Number has been preached, taught, prophesied, born-out, died-for, whatever the case, in just about all of history’s great reformers.  From Gautama Buddha in c. 563 BCE to Martin Luther King, Jr. in 1968, one theme stands out from all their wisdom:  there is something more and larger than yourself.  What can you imagine as this theme’s reciprocal, or antithesis?  Think of as many possible oppositions as you can.

The fall of Rome c. 455 CE

Now synthesize your list of oppositions into a summation.  It should reflect an inflated ego, whether it is one, many, or a system, it carries with it an awareness and action for self and for few – as well as those who benefit our self.  It also carries with it a reduced lack of awareness and action for the whole system – as well as those who we tolerate and/or are intolerant.  When viewed in this light, the inequality that is today’s America is absolutely no different from ancient Rome or Victorian Britain.  You have the superior and the inferior, and the two should remain mostly separate.  The inferior are such because they are illiterate.  They lack a good education because it is next to impossible to attain.  The inferior are diseased because of their illiteracy and lack of medical treatment because it is next to impossible to attain.  The inferior are unskilled workers because of their illiteracy to understand the complex nuances of business and ingenuity, and to gain this understanding is next to impossible without heavy coin.

Is my America-Rome analogy that far-fetched?  Your response should turn to civil action; we do live in a country that OFFERS a model of social-political freedom.  I come from a family and middle-class background that worked and works its ass off to gain a little more of the American dream.  During my generation, and perhaps during my children’s generation, we have seen those opportunities all but vanish.  My children and I face almost exactly what my grandparents faced during the Great Depression and World War II.  As a boy then, my father faced strict food and material rations for over fourteen years!  Our current Great Recession, economists state, began in 2007.  Here we are in mid-2012, five years later.

Whatever your situation, I will repeat what I said at the start.

Due in part to the nation-wide recession and severe federal-state education cuts and the increasing gap of social-economic inequality in America (families in poverty vs. families with great wealth), my workload and hours are increasing between 25-30% for the 2012-2013 school year.  However, my meek salary and annual increase has been frozen – while our cost-of-living continues to run free like a gorilla in a banana farm.  Even more astonishing, the social expenditures to address and manage our nation’s growing impoverished families – the exact families my students come from – are dropping through the basement in alarming amounts.  Let me reiterate:

The social expenditures to address and manage our nation’s growing impoverished families – the exact families my students come from – are dropping through the basement in alarming amounts, even disappearing!

And by the way, our enrollment/placement of special-needs students are increasing (and therefore class sizes with fewer teachers) because several identical charter schools in the region had to close their doors due to funding cuts.

In the boom years before the 2007-08 crisis, the top 1 percent seized more than 65% of the gain in total national income.  And while the GDP grew, most American citizens saw their standard of living fall into the basement.  In 2010, as the nation floundered to stay afloat, the 1 percent (even the top 10%) gained 93% of the additional income created in the so-called recovery.  As those at the top continue to enjoy the best healthcare, education, and benefits of wealth in a Reagan-freed-market system, they often fail to realize that, as Rome’s elite fatally ignored, “their fate is bound up” Stiglitz highlights, “with how the other 99 percent live.”

No matter the social, economic, or intellectual differences, we ALL need each other and MUST find and implement civilized efficient, evolving, fair systems toward the Greatest Good for the Greatest Number, or we will go down in history as the 2nd Rise and Fall of the 2nd Roman Empire.

(paragraph separation)

Creative Commons License
This work by Professor Taboo is licensed under a Creative Commons Attribution-NoDerivs 3.0 Unported License.
Permissions beyond the scope of this license may be available at https://professortaboo.wordpress.com.